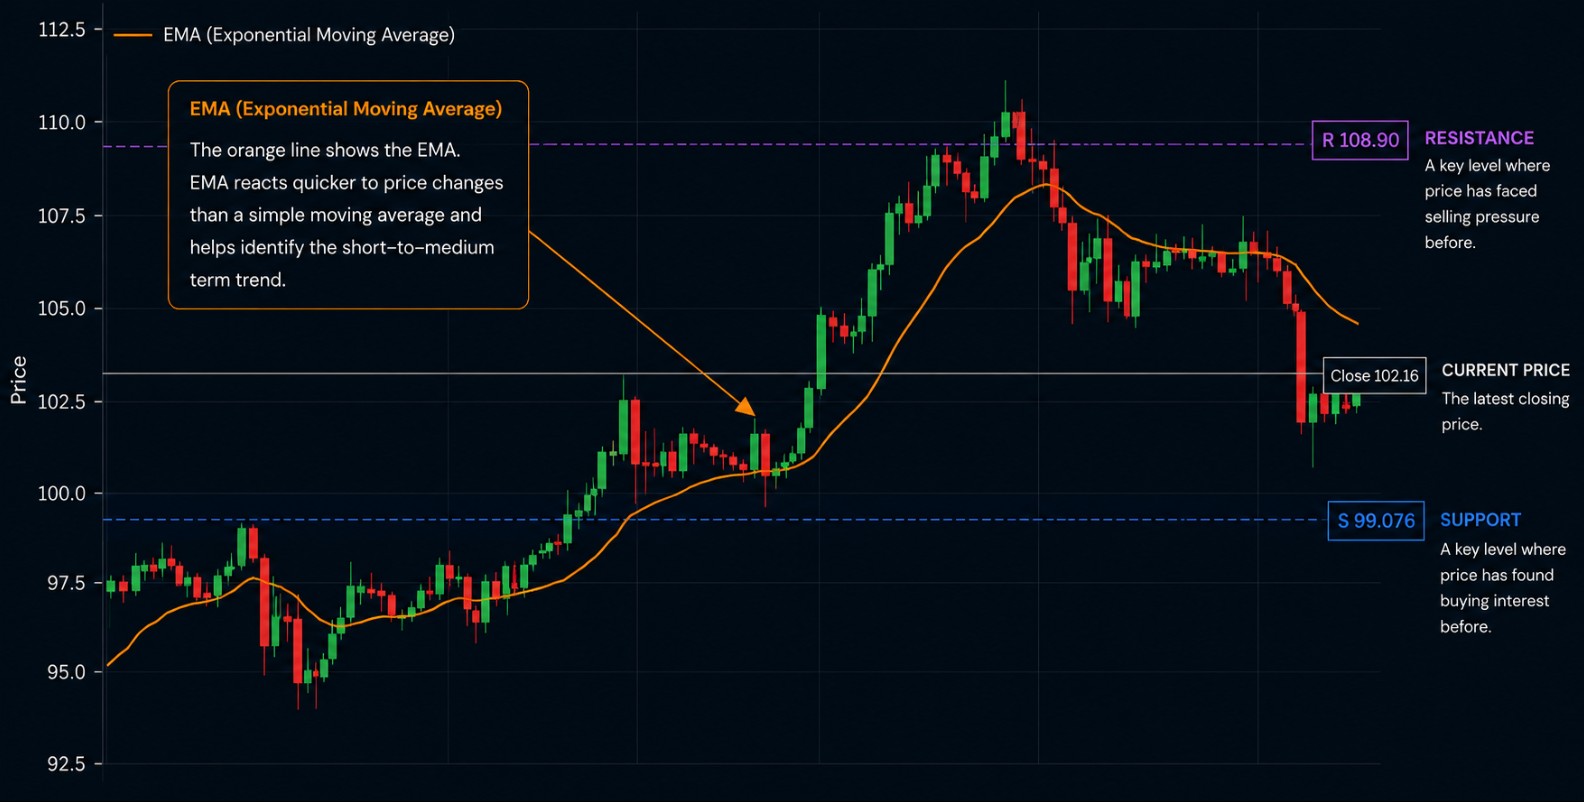
An exponential moving average smooths recent price movement and can help describe trend context. It follows price and can lag during fast changes.
How to interpret EMA
EMA gives greater weight to recent prices and therefore reacts faster to price changes than a simple moving average. Its meaning depends on the selected period and timeframe. Price above or below the EMA can provide trend context, but it should not be treated as a standalone entry or exit signal.
RSI
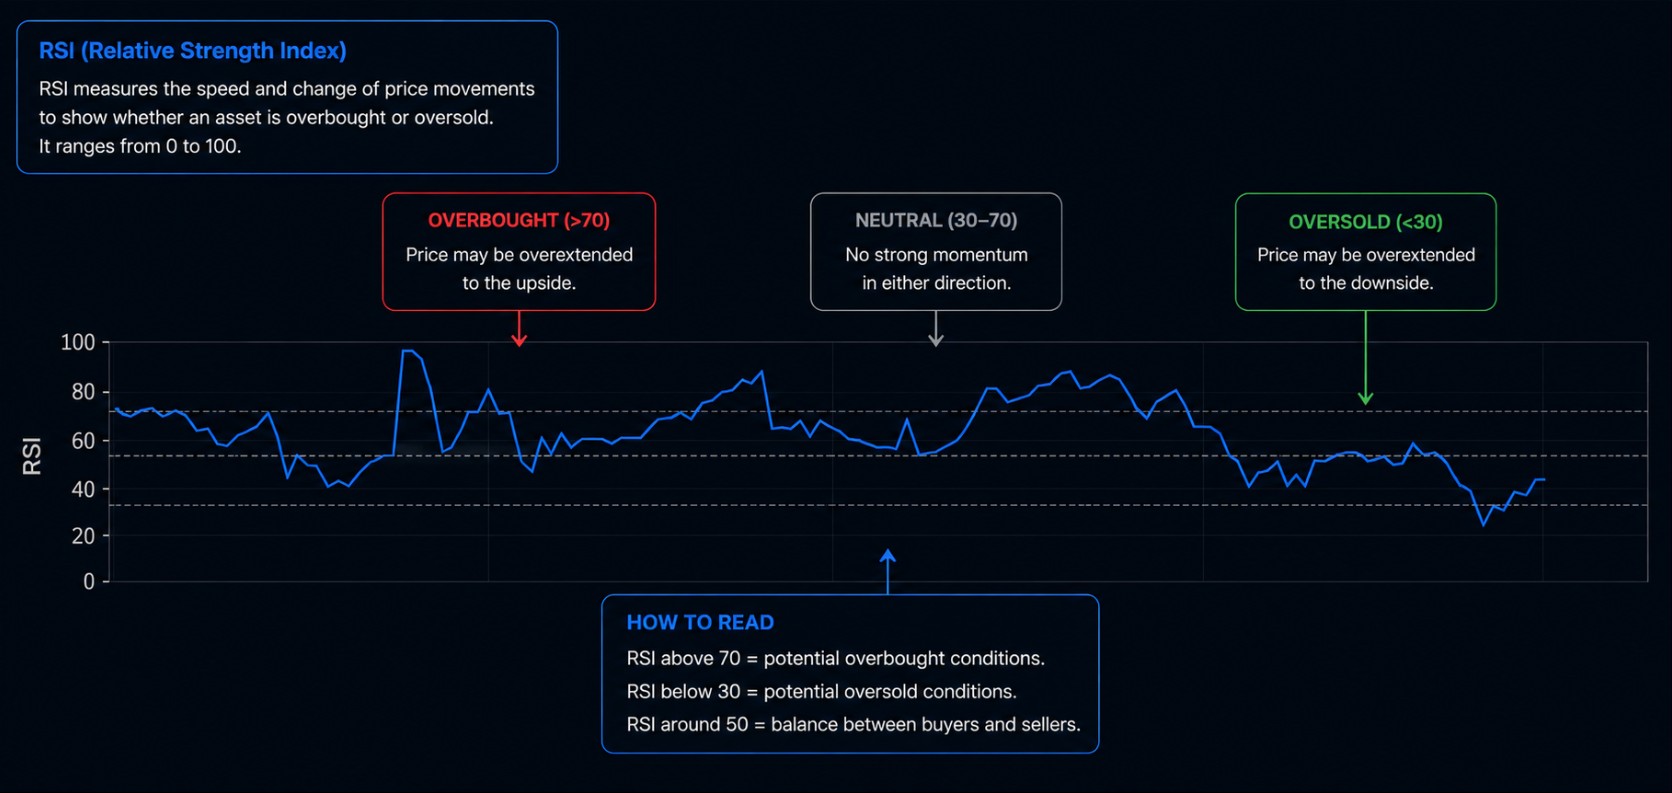
RSI can highlight momentum conditions. Overbought or oversold readings are not automatic instructions and should be interpreted with context.
Important context
RSI values above 70 or below 30 indicate potentially stretched momentum, not an automatic reversal or trading signal. During strong trends, RSI can remain overbought or oversold for an extended period. Values between 30 and 70 are not necessarily neutral—direction, slope and the position relative to 50 can still provide useful momentum context.
MACD
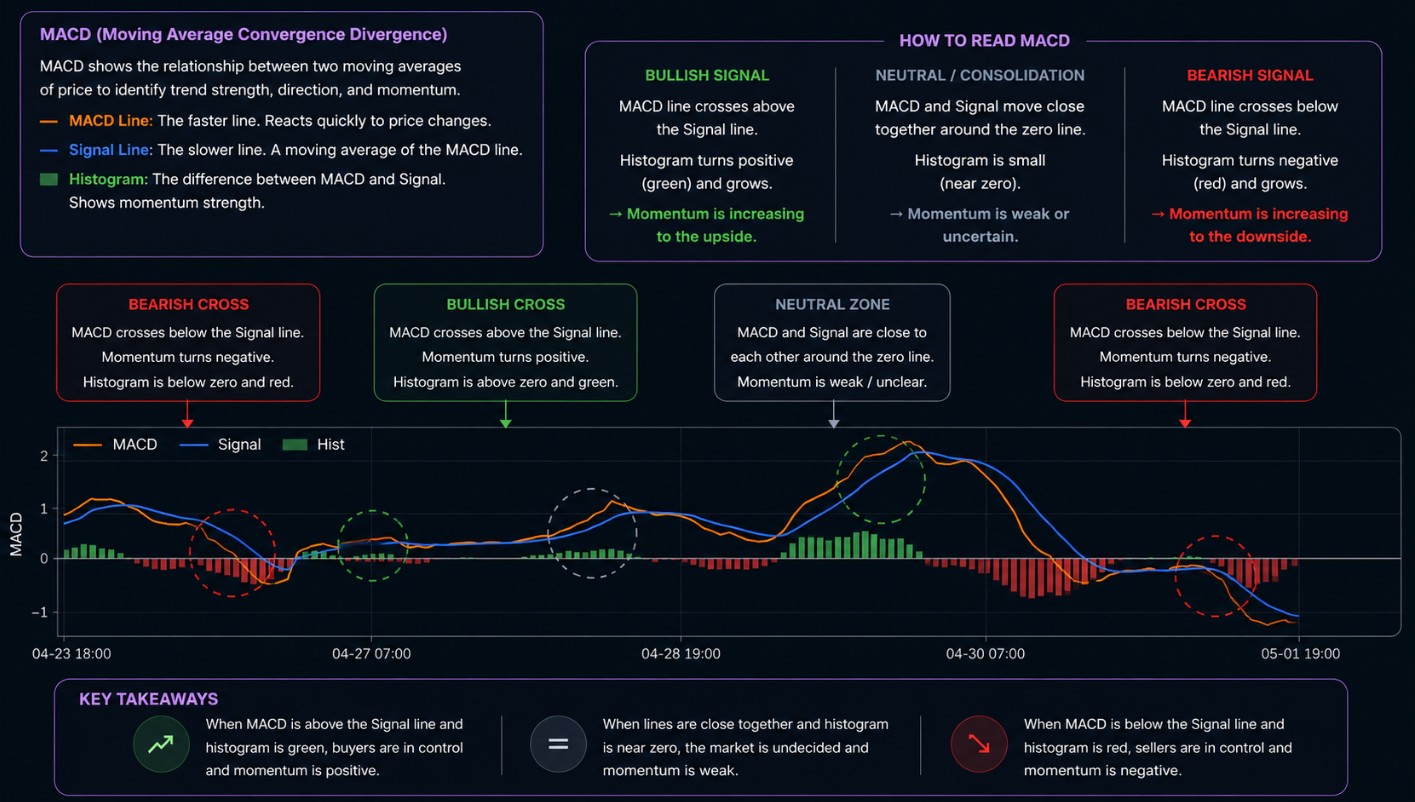
MACD compares moving averages to describe momentum shifts. It can be useful context, but it can also react late or conflict with other conditions.
Important context
A MACD crossover indicates a change in momentum bias, but it does not guarantee that momentum will continue to strengthen. The histogram, position relative to the zero line, market structure and timeframe should be considered together. Closely grouped lines and a small histogram usually indicate weak or mixed momentum rather than confirming consolidation on their own.
ATR
ATR describes recent volatility or range. It does not indicate market direction and should not be treated as a directional signal.
Indicators are tools, not decisions
Indicators can organize information, but they do not replace judgement, risk review, or independent validation.
Indicators are supporting evidence
Indicators provide supporting evidence, not standalone conclusions. Their interpretation depends on market structure, timeframe and the broader report context.
Educational content only. Not investment advice, trading advice, or signals.